correlation_length
Calculates an empirical functional form for SAS data characterized by a low-Q signal and a high-Q signal.
| Parameter | Description | Units | Default value |
|---|---|---|---|
| scale | Source intensity | None | 1 |
| background | Source background | cm-1 | 0.001 |
| lorentz_scale | Lorentzian Scaling Factor | None | 10 |
| porod_scale | Porod Scaling Factor | None | 1e-06 |
| cor_length | Correlation length, xi, in Lorentzian | Å | 50 |
| porod_exp | Porod Exponent, n, in q^-n | None | 3 |
| lorentz_exp | Lorentzian Exponent, m, in 1/( 1 + (q.xi)^m) | Å-2 | 2 |
The returned value is scaled to units of cm-1 sr-1, absolute scale.
Definition
The scattering intensity I(q) is calculated as
The first term describes Porod scattering from clusters (exponent = \(n\)) and the second term is a Lorentzian function describing scattering from polymer chains (exponent = \(m\)). This second term characterizes the polymer/solvent interactions and therefore the thermodynamics. The two multiplicative factors \(A\) and \(C\), and the two exponents \(n\) and \(m\) are used as fitting parameters. (Respectively porod_scale, lorentz_scale, porod_exp and lorentz_exp in the parameter list.) The remaining parameter \(\xi\) (cor_length in the parameter list) is a correlation length for the polymer chains. Note that when \(m=2\) this functional form becomes the familiar Lorentzian function. Some interpretation of the values of \(A\) and \(C\) may be possible depending on the values of \(m\) and \(n\).
For 2D data: The 2D scattering intensity is calculated in the same way as 1D, where the q vector is defined as
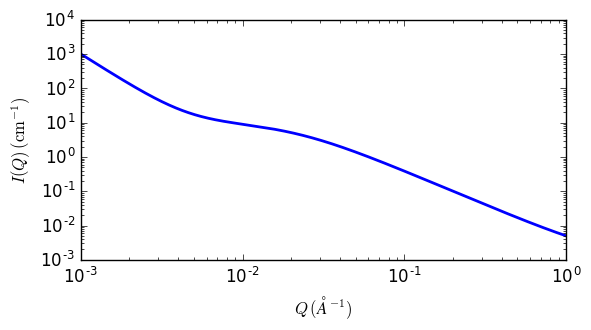
Fig. 83 1D plot corresponding to the default parameters of the model.
References
B Hammouda, D L Ho and S R Kline, Insight into Clustering in Poly(ethylene oxide) Solutions, Macromolecules, 37 (2004) 6932-6937