teubner_strey
Teubner-Strey model of microemulsions
| Parameter | Description | Units | Default value |
|---|---|---|---|
| scale | Source intensity | None | 1 |
| background | Source background | cm-1 | 0.001 |
| volfraction_a | Volume fraction of phase a | None | 0.5 |
| sld_a | SLD of phase a | 10-6Å-2 | 0.3 |
| sld_b | SLD of phase b | 10-6Å-2 | 6.3 |
| d | Domain size (periodicity) | Å | 100 |
| xi | Correlation length | Å | 30 |
The returned value is scaled to units of cm-1 sr-1, absolute scale.
Definition
This model calculates the scattered intensity of a two-component system using the Teubner-Strey model. Unlike dab this function generates a peak. A two-phase material can be characterised by two length scales - a correlation length and a domain size (periodicity).
The original paper by Teubner and Strey defined the function as:
where the parameters \(a_2\), \(c_1\) and \(c_2\) are defined in terms of the periodicity, \(d\), and correlation length \(\xi\) as:
and thus, the periodicity, \(d\) is given by
and the correlation length, \(\xi\), is given by
Here the model is parameterised in terms of \(d\) and \(\xi\) and with an explicit volume fraction for one phase, \(\phi_a\), and contrast, \(\delta\rho^2 = (\rho_a - \rho_b)^2\) :
where \(8\pi\phi_a(1-\phi_a)(\Delta\rho)^2c_2/\xi\) is the constant of proportionality from the first equation above.
In the case of a microemulsion, \(a_2 > 0\), \(c_1 < 0\), and \(c_2 >0\).
For 2D data, scattering intensity is calculated in the same way as 1D, where the \(q\) vector is defined as
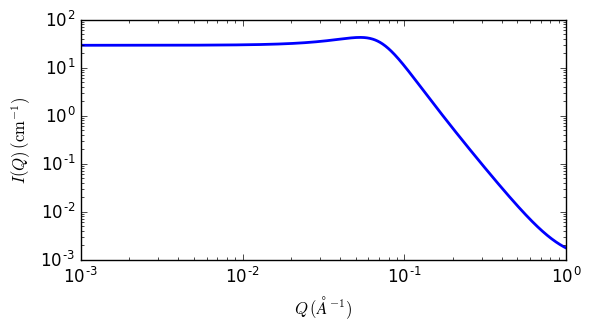
Fig. 106 1D plot corresponding to the default parameters of the model.
References
M Teubner, R Strey, J. Chem. Phys., 87 (1987) 3195
K V Schubert, R Strey, S R Kline and E W Kaler, J. Chem. Phys., 101 (1994) 5343
H Endo, M Mihailescu, M. Monkenbusch, J Allgaier, G Gompper, D Richter, B Jakobs, T Sottmann, R Strey, and I Grillo, J. Chem. Phys., 115 (2001), 580