guinier
Parameter |
Description |
Units |
Default value |
|---|---|---|---|
scale |
Scale factor or Volume fraction |
None |
1 |
background |
Source background |
cm-1 |
0.001 |
rg |
Radius of Gyration |
Å |
60 |
The returned value is scaled to units of cm-1 sr-1, absolute scale.
Definition
This model fits the Guinier function
to the data directly without any need for linearization (cf. the usual plot of \(\ln I(q)\) vs \(q^2\)). Note that you may have to restrict the data range to include small q only, where the Guinier approximation actually applies. See also the guinier_porod model.
For 2D data the scattering intensity is calculated in the same way as 1D, where the \(q\) vector is defined as
In scattering, the radius of gyration \(R_g\) quantifies the object’s distribution of SLD (not mass density, as in mechanics) from the object’s SLD centre of mass. It is defined by
where \(r_0\) denotes the object’s SLD centre of mass and \(\rho_i\) is the SLD at a point \(i\).
Notice that \(R_g^2\) may be negative (since SLD can be negative), which happens when a form factor \(P(Q)\) is increasing with \(Q\) rather than decreasing. This can occur for core/shell particles, hollow particles, or for composite particles with domains of different SLDs in a solvent with an SLD close to the average match point. (Alternatively, this might be regarded as there being an internal inter-domain “structure factor” within a single particle which gives rise to a peak in the scattering).
To specify a negative value of \(R_g^2\) in SasView, simply give \(R_g\) a negative value (\(R_g^2\) will be evaluated as \(R_g |R_g|\)). Note that the physical radius of gyration, of the exterior of the particle, will still be large and positive. It is only the apparent size from the small \(Q\) data that will give a small or negative value of \(R_g^2\).
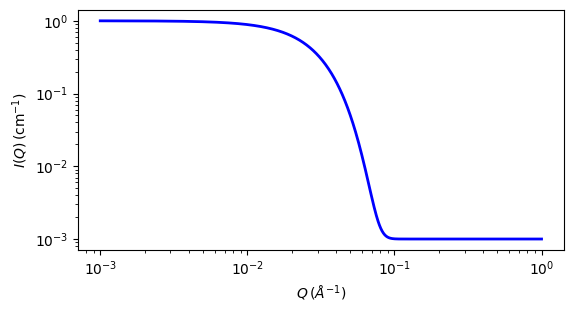
Fig. 125 1D plot corresponding to the default parameters of the model.
Source
guinier.py
\(\ \star\ \) guinier.c
References
A Guinier and G Fournet, Small-Angle Scattering of X-Rays, John Wiley & Sons, New York (1955)
Authorship and Verification
Author:
Last Modified by:
Last Reviewed by: