Mission
The purpose of building and operating large scattering facilities is to provide unique tools to answer new scientific questions with the final presentation of results (usually in the form of a paper) as the output. The biggest obstacle to that output is often the analysis of the acquired data. Data analysis software has been variously viewed as being in the domain of the scientist using the facility, a service to be provided by scattering facilities, or as the individual responsibility of the scientists running the facility beamlines. The result has been a proliferation of packages and libraries, many written and supported by one key person, often not as their primary responsibility.
Over the past decade several trends have contributed to exacerbate the analysis bottleneck: 1) As the techniques have matured the user pool has broadened. This combined with an apparent decrease in the overall level of programming taught to scientists, means that fewer users are capable of building their own analysis tools. 2) With the increasing maturity of the field, a large amount of basic modeling is well understood and developed. Even those capable of coding their own should not be wasting their time re-inventing the wheel but focus on new science and perhaps new analysis developments to enable that new science. 3) The quantity of data being produced by instruments and the complexity of the experiments being performed have increased. 4) Finally, as the general software landscape has moved towards increased quality of usability and support, users of scattering facilities, in particular new users, have similar expectations of the software they use to operate the instrument and process and analyse their data.
To enable the production and maintenance of software that meets users expectations, a greater level of resources needs to be applied to the problem. This has been recognised in the neutron scattering community through projects such as DANSE, Mantid, CCP-SAS and projects within the European Union Horizon 2020 programme such as SINE2020. While each facility or scientist may not be able to commit the necessary resources, pooling of expertise between facilities and with the user community into a single project can amplify the effort and provide gains in quality, functionality, longevity and supportability with obvious benefits to both the facilities and the users.
The aim of the SasView project is to provide open source, collaboratively developed software for the analysis of any small angle scattering data.
The collaborative development model is designed to encourage and enable contribution from a range of experts in small angle scattering, computer science and software development. Users of the software are encouraged to participate through bug reports, writing tutorials, submitting code and by providing new scattering models.
Current Scope and Functionality
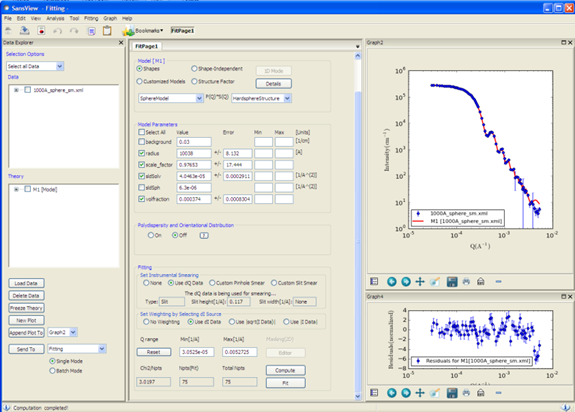
1D fitting screenshot.
SasView is an open source project currently hosted at GitHub. The software is written in Python with C and C++ modules providing some of the heavier computations. Persons interested in becoming developers are welcome and even encouraged. Have a look at how you can get involved or contact the project leadership team at management@sasview.org. Pull requests can also be made for one off contributions. Comments, suggestions, and other contributions are also welcome and can be made by emailing the development team at developers@sasview.org. The current list of tasks and bug tickets, which can be organized by milestone can be found here
SAS analyis is a fairly broad term, potentially covering a huge amount of ground and often meaning different things to different people. As part of this project several boundaries were identified and defined. The first boundary is the distinction between SAS reduction and SAS analysis. Reduction is defined as the process that removes all instrument specific “artifacts” and produces a reduced data set containing only the “science” of the material being investigated. If done perfectly reduced data from any instrument should lie on top of one another with minor caveats regarding differences in the contrast term arising out of the use of different types of radiation. The rationale is that every instrument is different and every source is different. Thus reduction will always be a process relatively unique to the instrument on which the data was taken and only the facilities’ instrument scientists are truly qualified to know what all those details are. By contrast, once in reduced form, the job of the user scientist can begin in earnest as that is the data that contains the information he/she is seeking. Further, at this point the “analysis” problem becomes a completely common and generic problem so that all facilities and the community at large can easily collaborate having now the exact same needs. There are grey areas where the distinction is not as clear. However we believe in most cases the problem can be reduced to this separation. SasView is designed to operate on reduced data and thus should be instrument agnostic.
The second demarcation is between real space and inverse space analysis. By inverse space analysis we mean the process of thinking about data in inverse space as collected, while by real space analysis we mean the process of thinking about the data in real 3D space. The first case represents the traditional approach to SAS analyis used by colloid and materials scientists while the second has been pioneered mostly by the biological scattering community. We believe that these are two very different (if complementary) ways of thinking about the problem and it would be very difficult to create a single user interface ideal for both. Thus SasView is designed as an inverse space modelling tool. We hope to build partnerships to interact with real space analysis packages such as the SASSIE project, providing if appropriate support in making them relevant beyond biological systems. Two methods cross this boundary: Distance distribution, P(R), and correlation function analyses which attempt a direct inversion of the data to real space with no a priori assumptions, and shape reconstruction or “ab initio” methods which seek to refine an arbitrary 3D real space model (again with no a priori knowledge) till its Fourier inversion fits the scattering data. The first method is incorporated into SasView. At this time the second is thought to be more appropriate for the real space analysis packages. The philosophy is to try to balance the desire to do all one’s analysis in one package with the need to keep the interface somewhat intuitive and easy to learn and use. The hope is to achieve this balance by packaging all the functionality likely to be wanted by most users of this package most of the time and to design and build interfaces with complementary packages to allow data to be moved transparently across applications when needed.
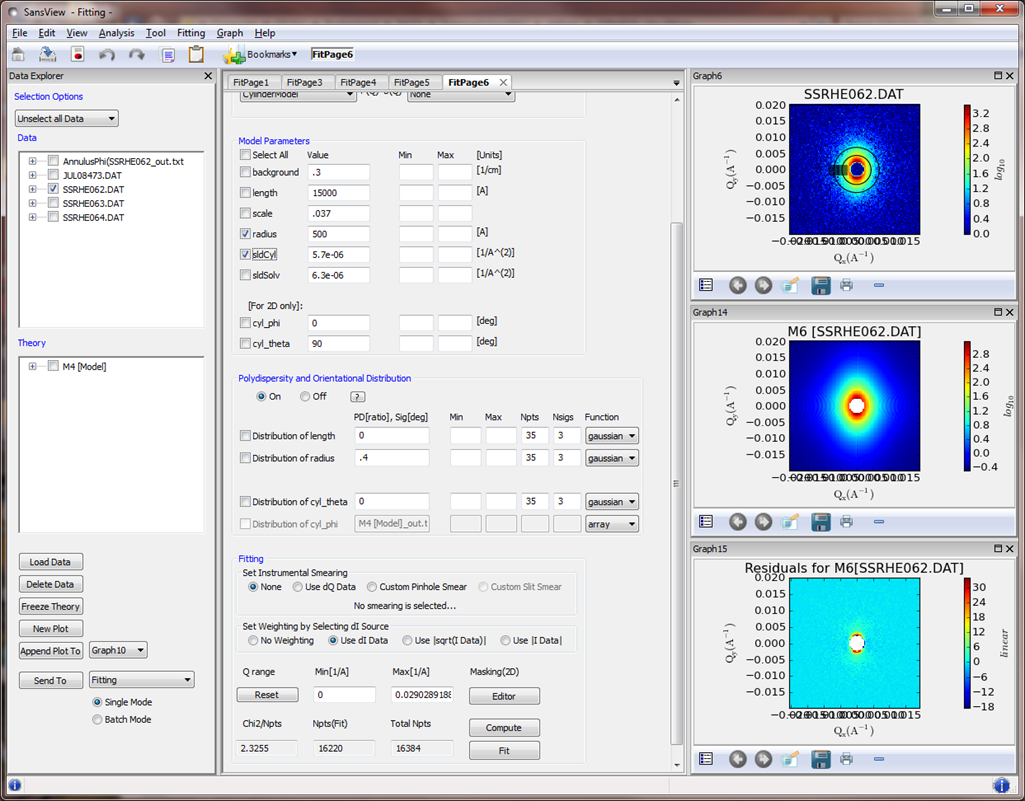
2D fitting screenshot
SasView supports the canSAS 1D XML file format, but will read almost any 1D ASCII column data (but not any associated metadata). For 2D data SasView reads the newly-ratified canSAS 2D NeXus HDF5 format in addition to the NIST 2D ASCII format. SasView was developed with a view to take advantage of modern computing power to make analysis of non-azimuthally symmetric 2D data (such as obtained under the influence of a directional field such as flow, or magnetic or electric fields) more routine.
Primary Features: Freely available, including source code; One click install for Mac OS and Windows; User friendly GUI, but also command line drivable; Extensive model library; Ability to accept user plug-in models.
Major GUI features: Poydispersity and orientational distributions can be applied to most shape models except custom ones - Current options include: rectangular, Gaussian, Schulz, log normal and array (an array distribution will take any 2 column ASCII data file and apply it as a custom distribution); Instrument smearing options include: none, Gaussian on each point read from data, custom pinhole and custom slit; Fit weighting options include none, intensity error bar read from the data, and the square root of the intensity; Complex constrained fitting (including simultaneous constrained fits); Circular, annulus, sector, boxQx, boxQy, and boxsum 2D cuts of data available; Plug-in model editor simplifies the creation of new models.
History
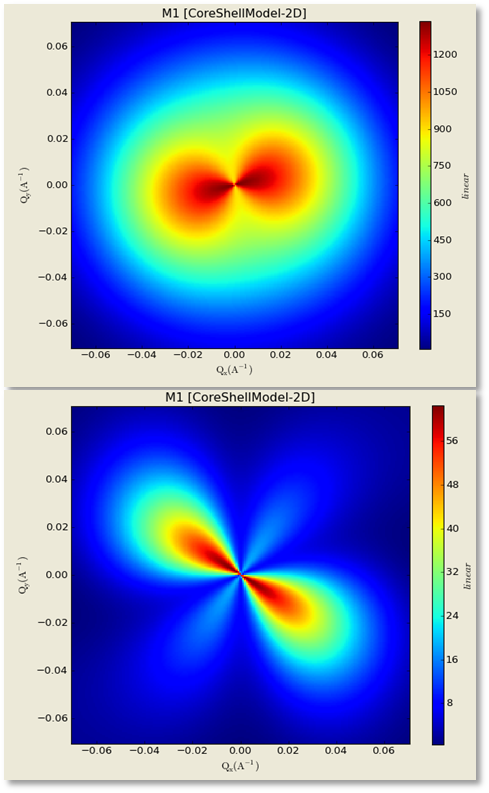
CoreShell simulation with Mcore parallel to the x-axis
and Mshell canted away. Top figure: polarisation (up,up)
Bottom figure: polarisation (up,down)
SasView evolved from the SansView project, the flagship application developed under the auspices of the 5 year NSF-funded DANSE (Distributed Analysis for Neutron Scattering Experiments) project led out of Caltech that began in May 2006. The Small Angle Neutron Scattering (SANS) portion of that project was led by the Chemistry Department at The University of Tennessee which continues to host some servers to this day. More information on the DANSE project itself can be found here while the SANS portion of the project is described at danse.chem.utk.edu.
The NSF project officially ended on November 30, 2011, culminating in the release of SansView 2.1.1 which incoporated much feedback from the community, particularly in respect of SliceView and PrView. From Dec 1, 2011 to April 2013, NIST, in co-operation with UMD, funded a full time developer in order to bridge the transition to a collaborative community project. At the same time the project was given a more appropriate name and work was undertaken to build a better infrastructure to support a professional development activity including aquiring a corresponding domain name. In the summer of 2012 both ISIS and the ILL contributed a summer intern to work on the project and contributed some new models and improvements to the plotting and model selection mechanisms. The initial release of SasView was at 2.2, acknowledging its parentage.
The project was presented at the SAS-2012 Conference in Sydney Australia, Nov. 18-23, 2012, and the first developer Code Camp was held in April 2013.
Current Status
The developer team currently hails from 7 neutron scattering facilities and 1 synchrotron facility. However few if any have SasView as a major component of their job. Given the nature of software development this currently means most development occurs during the yearly (sometimes twice yearly) code camps. While this has proven to be a highly successful approach, it limits the rate of progress. Nonetheless the team aims to produce a major release a year with significant refactoring, additions and improvements.
We have a rolling five year Roadmap and continue to seek more development resources whilst simultaneously making the most efficient use of those resources we have. For example bugs and feature requests are organised as work packages to better help manage priorities in the overall project.
Anyone interested in contributing to the development of SasView is encouraged to contact the management team. We have need of contributors with a broad range of skills!
Acknowledging SasView
If you found any SasView software package useful to your work please acknowledge its use in your publication as suggested below and reference the specific software and version as noted on: http://www.sasview.org/cite/. Please also consider letting us know by sending us the reference to your work, and we will add it to our list of publications. This will help us to ensure the long term support and development of the software.
This work benefited from the use of the SasView project, originally developed under NSF award DMR-0520547 and containing code developed with funding from the European Union’s Horizon 2020 research and innovation programme under the SINE2020 project, grant agreement No 654000.